-
- International (ENG)
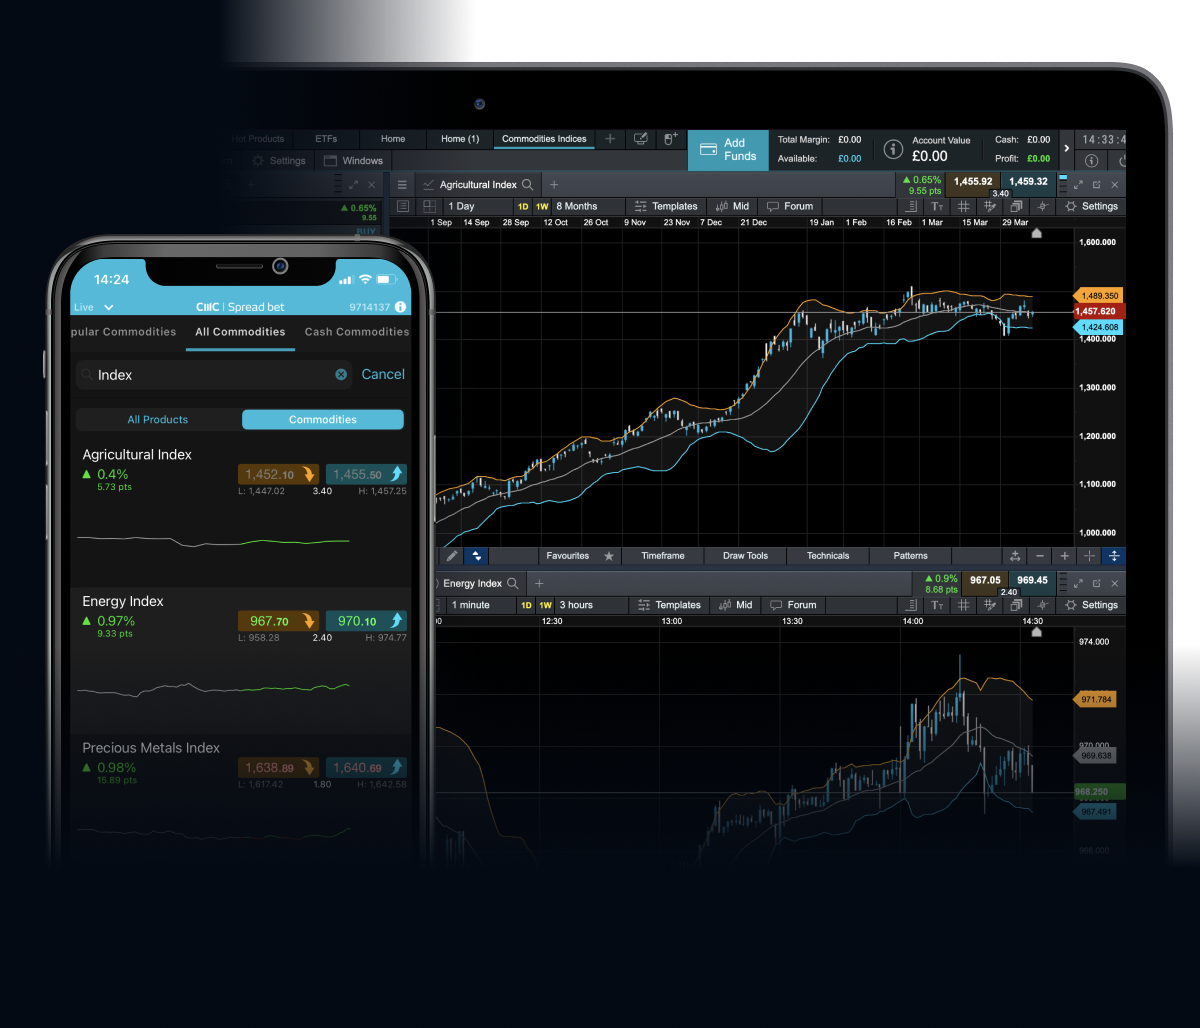
Spread bet or trade CFDs on baskets of commodities with our Agricultural Index, Energy Index and Precious Metals Index. These indices offer a unique, cost-effective way to trade on the wider commodity market, giving you exposure to multiple commodities in one trade.

Over 100 cash and forward commodities
Including all the favourites as well as lesser-traded instruments.
Trade out of hours
Favourites trade up to 23 hours a day, so you don't have to stop when the markets do.
No partial fills
And never any dealer intervention, regardless of your trading size.
'Cash' markets
Tighter spreads, no rollovers and charting back as far as 1992 to help your analysis.
Dedicated customer service
UK based, award-winning service online 24/5, whenever you’re trading.
Trade the whole sector
Take a view across a whole commodity sector from a single position, with our bespoke commodity indices.
Each commodity index represents a different sector of the commodity market: Agriculture, Energy and Precious Metals.
Agricultural Index
The Agricultural Index contains Soybean, Corn, Soybean Meal, Wheat, Coffee Arabica, Soybean Oil, Sugar Raw, Cotton, US Cocoa, Coffee Robusta, Sugar White and Oats, covering a broad spectrum of the soft commodities sector.
Energy Index
The Energy Index is designed to give an indication of how the energy sector is performing. Its constituent commodities are Heating Oil, Natural Gas, Crude Oil Brent & WTI, Gasoline and Low Sulphur Gasoil. Crude oil is one of the most popular raw materials to trade across the world.
Precious Metals Index
The Precious Metals Index groups together several precious metals so you can get exposure to the sector as a whole. It consists of Gold, Silver, Platinum and Palladium, where gold is one of the top traded commodities on our platform.
Our commodity indices group together individual commodities to make a commodities ‘basket’. The indices track the underlying prices of the commodities within that index. If the individual commodity prices in that index increase, then the value of the index will go up. Conversely, if the individual commodity prices decrease, then the value of that index will fall.
There are several benefits to commodity index trading as opposed to trading individual commodities. Firstly, it can be a more cost-effective and efficient way of trading the market, as it allows you to take a view on a commodity sector as a whole, without having to open a position on each individual commodity. Likewise, this can be a good way for you to diversify your portfolio.
However, it's important to be aware that spread bets and CFDs are high-risk, speculative products. High volatility combined with leverage could lead to significant losses. As with any leveraged product, both profits and losses will be based on the full value of your position. While you could make a profit if the market moves in your favour, you could just as easily make significant losses if the trade moves against you and you don’t have adequate risk-management in place.
View the spreads, margin rates and trading hours for our 3 major commodity indices in the table below.
| Instrument | Margin rate | Minimum spread | Trading hours |
|---|---|---|---|
| Agricultural Index | 10% | 3.4 | 09:45 - 13:45 / 14:30 - 17:30 (Mon to Fri) |
| Energy Index | 10% | 2.4 | 01:00 - 22:00 (Mon to Fri) |
| Precious Metals Index | 10% | 1.8 | 23:00 - 22:00 (Sun to Fri) |
For the Energy Index and Agricultural Index, the components were initially weighted according to the average daily trade value of the nearest six futures contracts, where available, for the 12 months preceding the index launch date, based on the initial index value of $10m. For the Precious Metals Index, Gold and Silver are split equally to collectively make up 70% of the index weight. The remaining two components, Platinum and Palladium, are also split equally and collectively make up 30% of the index weight. Subsequent index reviews are applied as shown in the index methodology.
Expecting big things in energy? Diversify your portfolio and spread risk with our unique commodity indices, which allow you to take a view on a commodity sector as a whole with a single position.


Fast execution, exclusive insights and accurate signals could prove to be vital to your success as a commodity index trader. Our award-winning trading platform was built with the committed commodity trader in mind.
Industry-leading charting
Our charting package ranked highest for charting in the 2019 Investment Trends survey*. Choose from over 115 technical indicators and drawing tools, more than 70 patterns and 12 in-built chart types.
Advanced order execution
We offer a range of advanced order types, including trailing and guaranteed stop losses, partial closure, market orders and boundary orders on every trade, so you have the flexibility to trade your way.
Client sentiment tool
Award-winning app*
Best Trading App
Financial Times Investment & Wealth Management Awards
Highest Overall Customer Satisfaction
Investment Trends UK Leverage Trading Report
Best Platform Features
Investment Trends UK Leverage Trading Report